
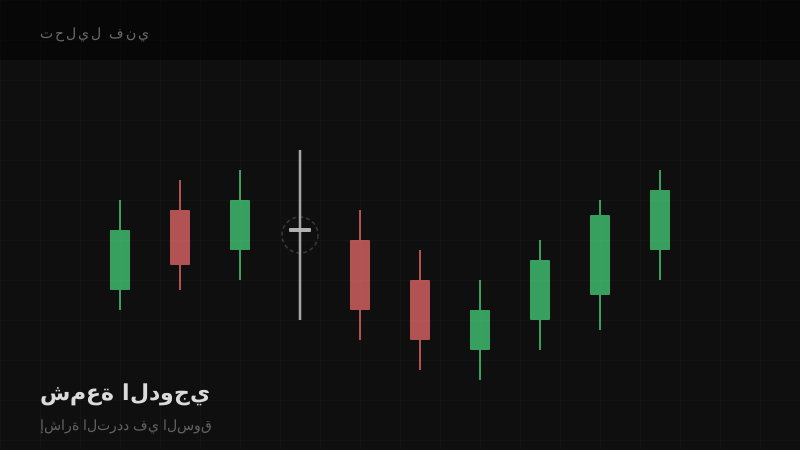
The doji is one of those candlestick patterns that stops experienced traders mid-scroll. It looks like a cross on the chart: opening and closing prices are nearly identical, with wicks extending both up and down. That shape is telling you something specific: neither buyers nor sellers won that session.
What Is a Doji?
A doji forms when the opening and closing prices are the same, or very close. The body is flat or nearly absent. Wicks extend above and below, showing that price moved in both directions during the session but closed right where it started. The market fought, and nobody won.
The 4 Main Types
Not all doji are the same. The shape of the wicks tells you more about the nature of the indecision.
Standard Doji
Small body in the middle, roughly equal wicks on both sides. General indecision, no clear push from either direction.
Gravestone Doji
Body at the bottom, long upper wick, almost no lower wick. Bulls pushed price up during the session, then got pushed back down to the open. This tends to appear at the top of a move and can precede a pullback.
Dragonfly Doji
Body at the top, long lower wick, almost no upper wick. Bears pushed price down, then buyers overwhelmed them before the close. Often appears at the bottom of a move.
Long-legged Doji
Long wicks in both directions. Extreme indecision, with violent swings in both directions before settling near the open. Worth paying close attention when volume is high.
How to Use It
A doji alone is not a signal. Context is everything.
- Doji after an extended rally: buyers are losing conviction, potential reversal ahead
- Doji at strong resistance: a warning for anyone already long
- Doji after a sustained selloff: sellers may be exhausted, watch for a bounce
- Doji at strong support: potential base forming
- Doji with high volume: carries more weight than a low-volume doji
The rule: the doji raises a question. The next candle answers it. Wait for confirmation before acting.
What to Do When You See One
- Do not jump in immediately on the doji candle itself
- Wait for the following candle to confirm direction
- Check where you are on the chart: at a key level, or in the middle of nothing?
- Check volume: a doji at a key level with above-average volume deserves attention
A doji is a pause, not a direction. It tells you the market is reconsidering. Whether price reverses or continues depends on what comes next and where the doji appears. Learn to read the setup, not just the shape.